State of IT 2026: Insights into PC attach rates

Upon analyzing the findings on total IT spending from the recently released Spiceworks State of IT 2026 report, it became clear that a dollar isn’t always just a dollar.
For example, across more than 300 organizations worldwide, their spending on AI software (both on-premises and cloud-based) as a percentage of their spending on IT computing infrastructure ranged from 0.6% to 11.5%, with a median of 2.7% — a relatively modest amount, given the general enthusiasm these days for all things AI. However, this doesn’t include their spending on associated servers, storage, networking, and other essential infrastructure that’s crucial for the successful implementation of enterprise AI initiatives. We don’t know for sure, but my colleagues and I estimate that the total amount for all AI-related spending could easily be 4 to 5 times higher than the range cited above.
PC attach rates
This brings us to the focus of this article: PC attach rates. The core idea is that for every $1 spent on PCs, each organization spends some additional amount on things that are attached to the PCs — such as peripherals (e.g., keyboards, mice, monitors), printing, and external storage. Across nearly 500 organizations in the State of IT 2026 dataset, the distribution of values for (spending on PC- attached) / (spending on PCs) gives us the PC attach rate.
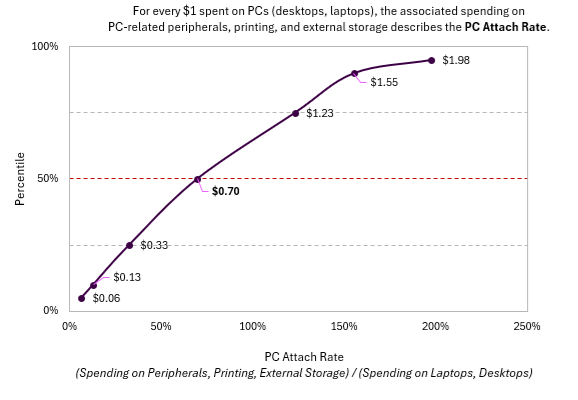
For every $1 spent on PCs (desktops, laptops), the associated spending on peripherals, printing, and external storage yields the following insights about the PC attach rate:
- A total range of $0.06 to $1.98. This represents the 5th percentile to the 95th percentile, also known as the 90% confidence interval (CI), which generally excludes outliers on both extremes.
- A “middle 50%” range of $0.33 to $1.23. This represents the 25th to 50th percentile, also known as the innerquintile range (IQR).
- A median of $0.70. By definition, the median represents the 50/50 point of the entire distribution of values for PC attach rate; half of all respondents were above the median, and half were below.
The average was $0.86. When the average (mean) differs from the median, it’s because the distribution of values is asymmetric (i.e., not a nice bell-shaped curve). In this case, a relatively smaller number of PC Attach Rates on the higher side of the curve pulls up the overall average. (From longstanding habit, most people just use the average — but this is almost always misleading because of asymmetry. Do better analysis and use the median, not the average.)
Visually, you can easily find all of these points on the following curve.
Source: Spiceworks Ziff Davis State of IT 2026, Aberdeen, January 2026
How is this useful to your organization?
- It provides a benchmark for how your spending in these areas compares to that of a broad, global sample.
- It provides a way to think about your PC and PC-related spending that could give your organization additional buying power with leading PC brands that also offer a portfolio of peripherals, printing, and external storage. Spend more, save more, maximize vendor-integration and support — and perhaps without having to pinch as many pennies as possible with a hodge-podge of off-brands.
- You may find it useful in other ways as well — let us know; we’d love to hear about them!
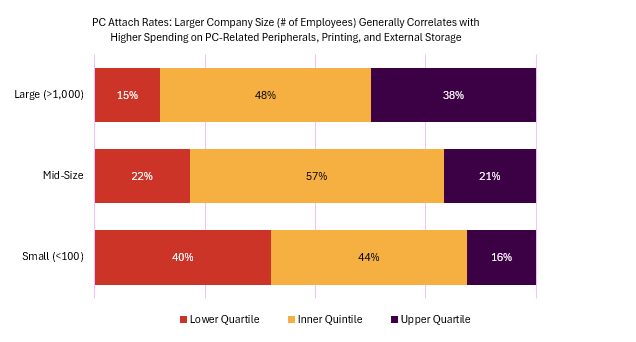
PC attach rates by company size and industry
The upper quartile (top 25%) of the PC attach rate curve contained companies of all sizes. Not surprisingly, however, larger company size (in terms of the number of employees) correlates with higher spending on peripherals, printing, and external storage.
Source: Spiceworks Ziff Davis State of IT 2026, Aberdeen, January 2026
Industries that were most strongly represented in the upper quartile for PC attach rates included financial services, engineering, automotive, government, healthcare, software, and IT services. (Other industries may also be in the upper quartile, but did not have enough responses in the State of IT 2026 dataset to be statistically meaningful.)
Spending on PCs and PC-attached, as a percentage of total IT spending
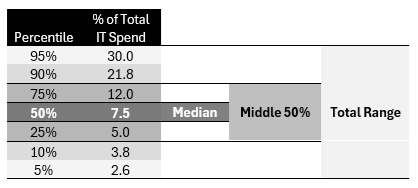
The analysis above was based on the ratio of spending on PCs and PC-attached. Here’s a different look at the same data that looks at the combined spending on PCs and PC-attached, as a percentage of total IT spending:
- A total range of 2.6% to 30% (the 90% confidence interval).
- A “middle 50%” of 5% to 12% (the innerquintile range).
- A median of 7.5%.
The average was 10.9%. As mentioned above, this is an asymmetric distribution, skewed by a relatively smaller number of values on the higher side of the curve — another reminder to use the median, not the average.
Source: Spiceworks Ziff Davis State of IT 2026, Aberdeen, January 2026
As mentioned above, these findings provide a useful benchmark for comparing your organization’s spending in these areas with that of a broad, global sample. Potentially, it may help you communicate and leverage your organization’s buying power in these areas to greater advantage.
Additional Research Notes
- The Spiceworks Voice of IT laptops survey also asked about this topic, but in a slightly different way (“What percentage of your IT budget is typically allocated to laptops and laptop-related peripherals and devices?”). In addition, 93% of the respondents were from organizations with fewer than 1,000 employees. Taken together, this makes an apples-to-apples comparison difficult. For example, just 5% of the State of IT 2026 respondents spent over 30% of their total IT budget on PCs and PC-attached, as compared to 25% of the Voice of IT survey.
- Be sure to read the related analysis of the Voice of IT laptop survey on tech debt.
- The current Voice of IT survey, on data storage and recovery, has been launched. We look forward to sharing those results with you in the coming weeks.